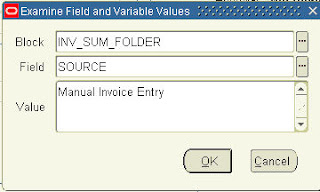
The Oracle eBusiness Suite / Applications provides a number of useful diagnostic and interrogative tools accessible from the front end. One of these tools is Examine accessible via Help > Diagnostics > Examine from the Oracle Forms interface.
My Top 8 Uses for Examine functionality:
1. Where does that field go? BLOCK.FIELD shows VALUE
 The first thing you see on Examine is the Block, Field and Value of the cursor item. This is useful for working out which column in a table/view the field maps to (guess based on name of field), useful in conjunction with Help > About this record, and of course the value to confirm you've identified the right field
2. Let me change it! BLOCK.FIELD edit VALUE
Not only does Examine enable you to see a value, it also allows you to overwrite the value! Examine and get the BLOCK and FIELD you want to change, change it, Okay, and Save. Of course this will bypass any validation and may cause a lovely FRM error and break something, but if you really have the need and it works, then hey, I'm not going to stop you. Oracle Support might not like you anymore but that's your decision.
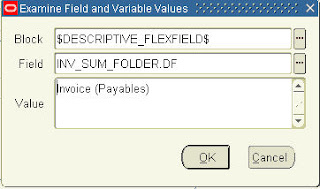
3. What the DFF? BLOCK.*_DF
If you've every wondered what the name of that descriptive field was on the item component widget handle, or whatever form, then wonder no more! Go to the block where your DFF is, Examine and chose the *_DF field in the same block. Voila! There's your descriptive flexfield name (and Application name in brackets).

4. What do I need to reference? BLOCK.FIELD
Context fields in a descriptive flexfield (DFF) require a reference to BLOCK.FIELD. No you've got an easy way to work it out.
5. What's that hidden value? BLOCK.FIELD (Hidden)
If a field is not displayed on the form, then Examine enables you to see the value. This is especially useful for developers when you want to view the value of a lookup code or similar field that you can't see on the front end.
6. What did I just do? SYSTEM.LAST_QUERY
This displays the last query run. Not always useful, but occasionally saves doing a trace via Help > Diagnostics > Trace.
7. What value was that profile option set to? $PROFILES$.PROFILE_OPTION_NAME
Examine and selecting block $PROFILES$ and then dropping down the FIELD list of values displays the internal names of the profile options set for your session. Helpful for checking the value of a profile option if you know what you're looking for.
8. What am I connected to? $ENVIRONMENT$.TWO_TASK
This shows you the Oracle SID of the database you are connected to.
Also worth a look:
Help > About this record: Shows the "Row Blame" information and of course the table/view that the block is based on.
Help > Diagnostics > Trace: Crucial in troubleshooting errors and performance issues as a separate weapon to profile option based trace enable.
Help > Properties > Item: Handy when you're looking to use Forms Personalizations
Help > Properties > Custom Code > On/Off: Very useful when you've developed extensions/customizations using CUSTOM.pll
Happy Examining!


2 comments:
Hi Robert,
Do you know any way to get Option Examine in read only mode ?
For security reason, we want to keep this tool but not to allow user to change data.
So Value block should be changed to read only. But we don't know where this form is coming from (user exit call to FND DEBUG when choosing option examine menu entrie)
thanks
Hi,
I saw your post on forums also? so not much luck there either.
Unfortunately the code for Help - Examine is compiled down C code, so without the source it's gonna be pretty tough! Looks like some traces in libfnd.a but not enough to go on. Anyone else out there got any ideas?
Gareth
Post a Comment